Variant Calling
The Variant Calling module is divided into two submodules: Somatic and Germline variant calling. Both provide interactive tables for reviewing, filtering, and flagging variants for the final clinical report, along with integrated IGV visualisation for read-level validation.
For general information about working with tables (sorting, filtering, column visibility, export, and flagging), see Working with Tables.
Filtering Variants
When you first open either submodule, a set of filters is applied automatically to focus the view on the most clinically relevant variants. These are not permanent — you can adjust or remove them at any time using the filter menu.
Somatic variant calling:
| Filter | Default value | Description |
|---|---|---|
| gnomAD NFE | ≤ 0.01 | Rare variants only |
| Tumor coverage depth | > 10 | Sufficient read support |
| Consequence | all except synonymous variant
|
Exclude silent mutations |
| Gene region |
exon and splice only |
Coding regions only |
Germline variant calling:
| Filter | Default value | Description |
|---|---|---|
| gnomAD NFE | ≤ 0.01 | Rare variants only (for more options, see required columns |
| Coverage depth | > 10 | Sufficient read support |
| Consequence | all except synonymous variant
|
Exclude silent mutations |
| Gene region |
exon and splice only |
Coding regions only |
| ClinVar significance | all | Filter by clinical significance classification |
If the table appears empty, the most likely cause is that no variants pass the default filters for this patient. Open the filter menu and relax the gene region or gnomAD threshold to verify.
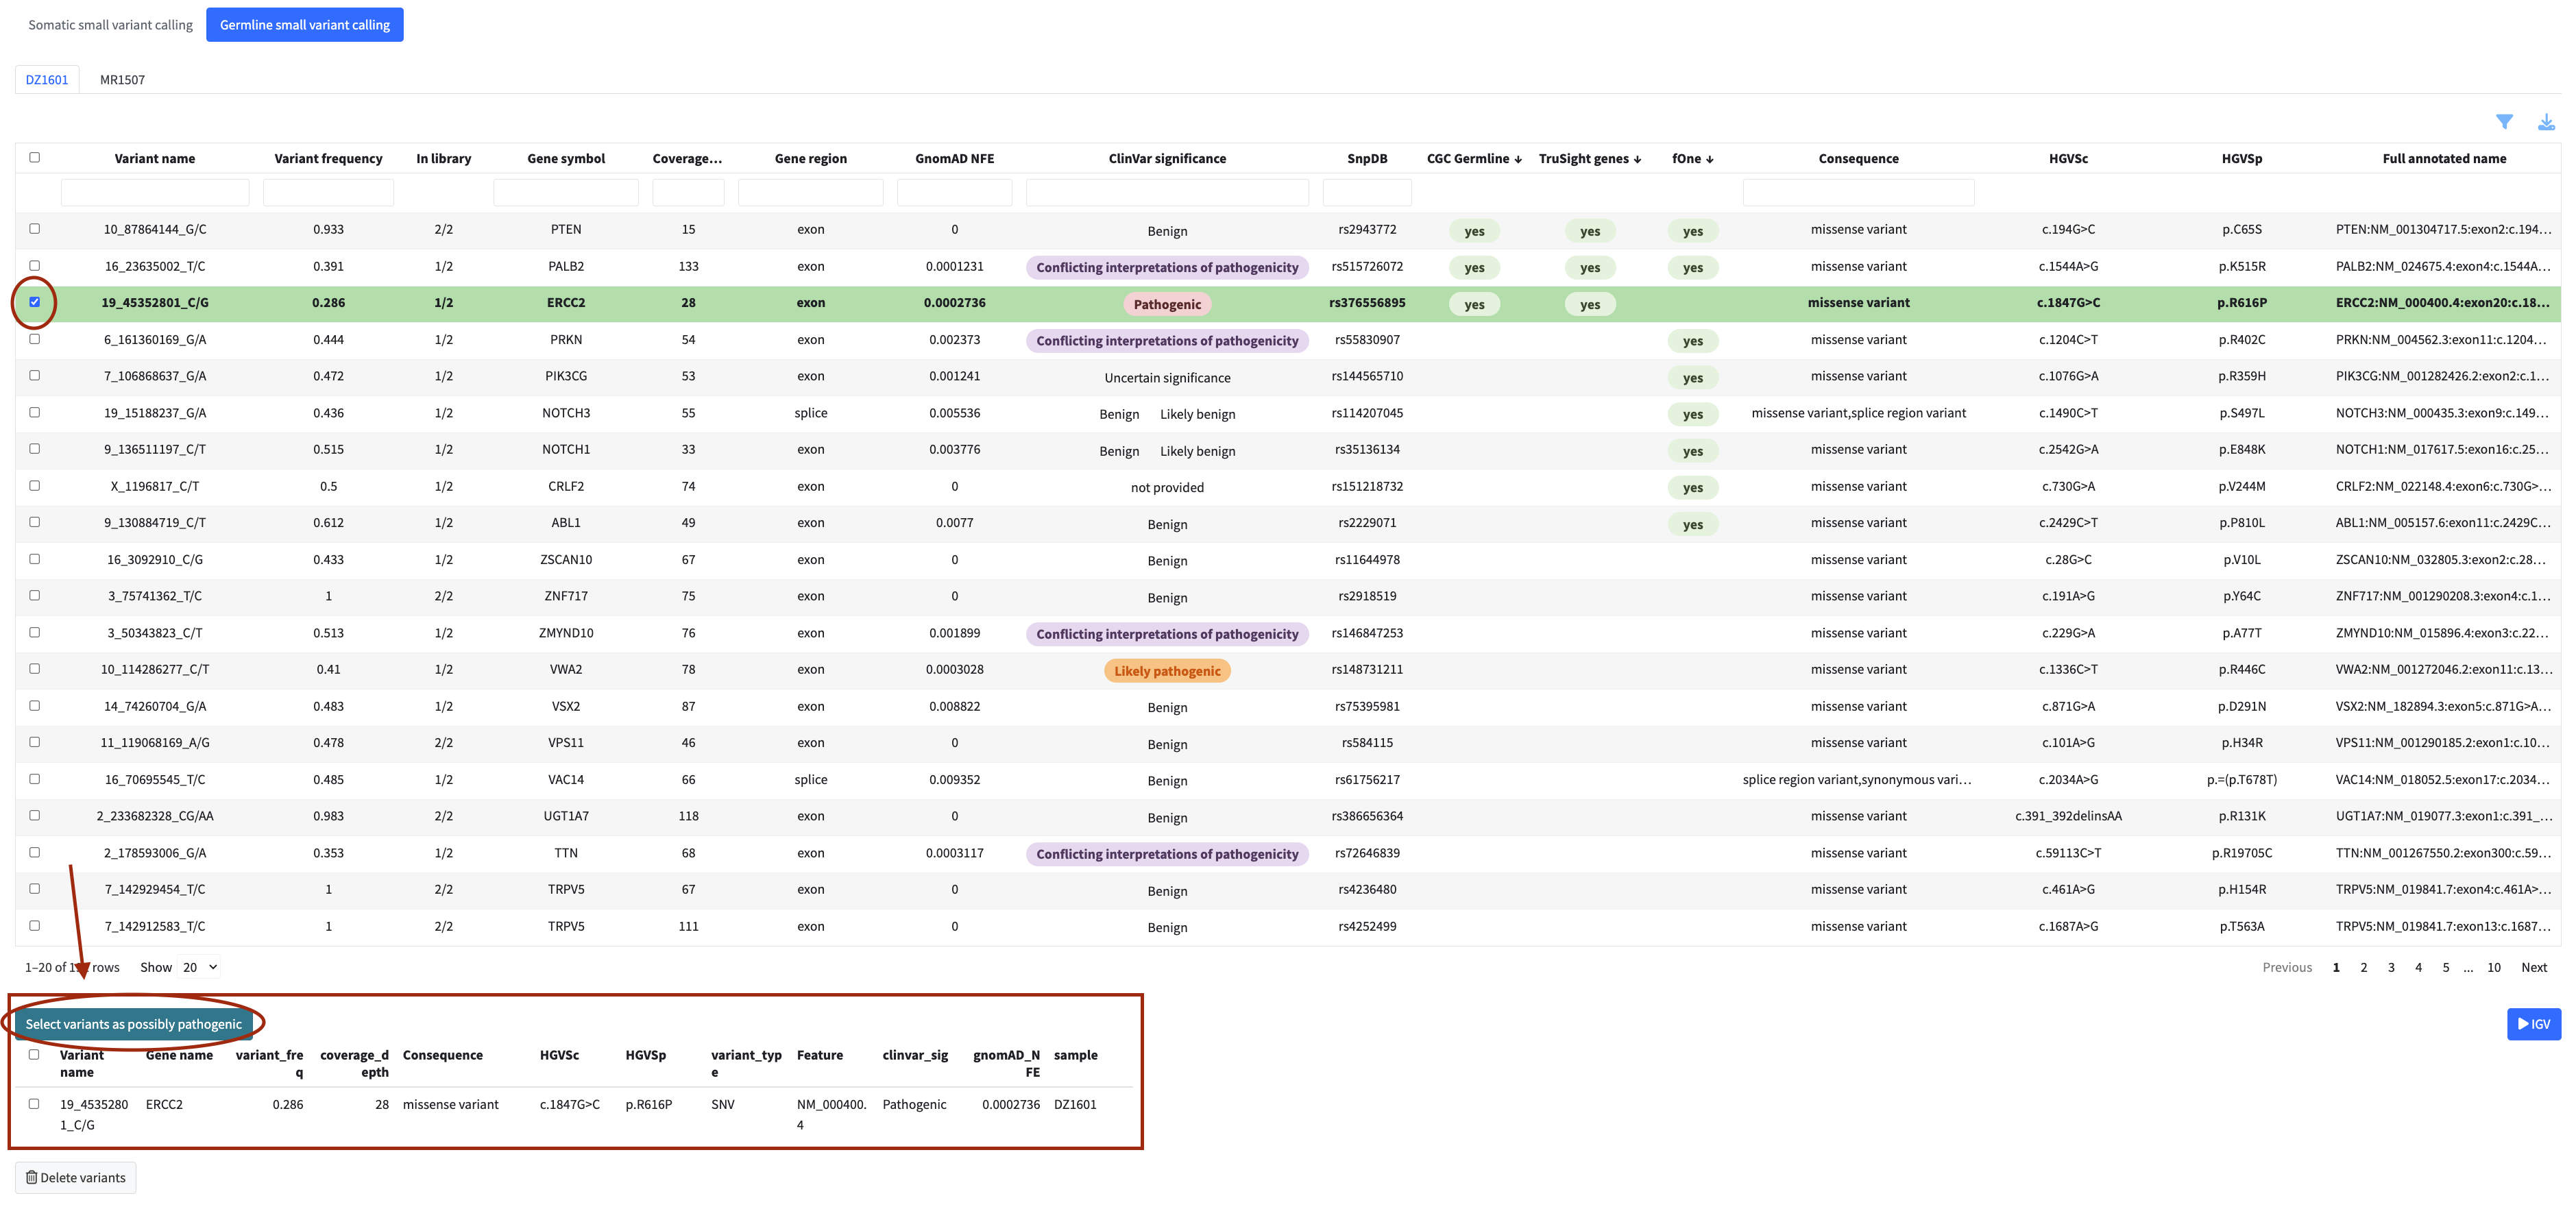
Flagging Variants
Select variants from the table and click Select variants as possibly oncogenic (somatic) or the equivalent button in germline to flag them for the report. Flagged variants appear in the review panel below the table, where you can also remove items from the selection.
Flagged variants can be opened in the IGV viewer for read-level validation. Use the IGV dropdown on the right side of the module to select one or more patients (up to 4) and click Go to IGV to navigate to the IGV module with the selected variants pre-loaded.
IGV requires BAM files. If no BAM files were provided for this dataset during upload, the IGV dropdown will not be available.
Somatic-Specific Visualisations
The somatic submodule includes two additional visualisations, available as collapsible panels below the main table. Both can be downloaded using the export button in the top right corner of each panel.